
Understanding the Basics of the Iron-Carbon Phase Diagram
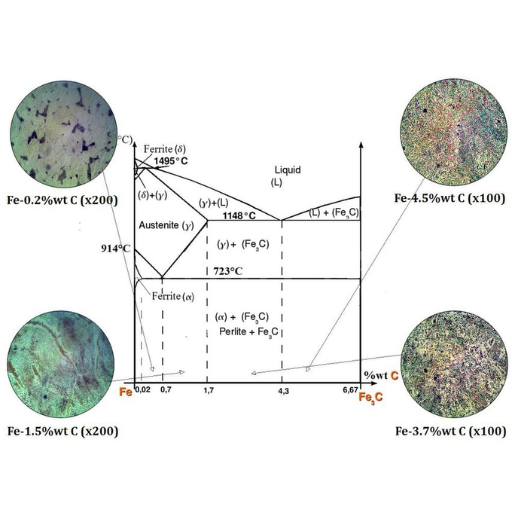
Image source: https://www.researchgate.net/
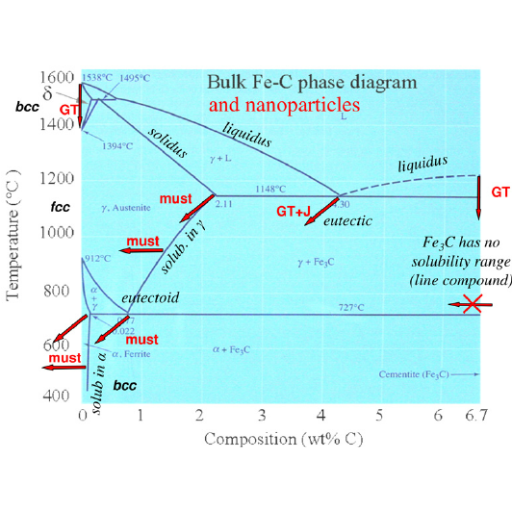
The iron-carbon phase diagram can be described as a graphical summary that presents the stages whereby carbon and iron occurs. It outlines how carbon is related to iron at different temperatures and percent of carbon found in it. In addition, this diagram contains several sections or lines which show when the iron-carbon alloy changes from a solid to liquid state. By knowing these basic constituents with their reactions process; therefore, engineers can be able to anticipate and adjust the properties of steel and its alloys during manufacturing operations like heat treatment
What is a phase diagram and why is it useful?
The components and phases of the iron-carbon phase diagram
The iron-carbon phase diagram is made up of several components and phases which are all important in influencing the properties of steel and cast iron.
- Ferrite (α-iron): It is stable at ambient temperature with a body-centered cubic structure. It is soft and ductile. Its carbon solubility is low, about 0.022%.
- Austenite (γ-iron): Austenite has a face-centered cubic structure that can accommodate more carbon content up to 2.14%. It is non-magnetic and exists at high temperatures.
- Cementite (Fe₃C): This intermetallic compound also known as iron carbide contains about 6.67% carbon atoms. Cementite is very hard and brittle hence it contributes largely to the strength and hardness of steel.
- Pearlite: This consists of alternating layers of ferrite and cementite in a microstructure that results from eutectoid transformation at lower temperatures. It provides adequate strength together with ductility.
Distinguishing between ferrite, austenite, cementite, and pearlite
To distinguish between ferrite, austenite, cementite and pearlite, it is necessary to recognize their distinctive nature and functions in the iron-carbon phase diagram.
- Ferrite (α-iron): Ferrite is a body-centered cubic (BCC) form of iron that is stable at room temperature. It has low carbon solubility (up to 0.022%) and is known for its softness and ductility. It’s magnetic and provides a structure that can be significantly deformed before breaking.
- Austenite (γ-iron): Austenite features a face-centered cubic (FCC) structure and can dissolve more amount of carbon content up to 2.14%. This phase remains stable at higher temperatures but it does not have magnetism properties. Therefore, this phase plays an important role especially in high temperature processes and also must be present during production of stainless steel.
- Cementite (Fe₃C): Cementite is an intermetallic compound having carbon content of 6.67% called iron carbide. It’s hard as well as brittle which makes stell stronger and harder than before. But it cannot deform further because it will break due to brittleness inherent in cementites structure.
- Pearlite: Pearlite is a microstructural element consisting alternations of ferrite with cemented formed at lower temperatures by eutectoid transformation from pearlitic state offering balanced mixtures of strength and ductility thus making it significant structural constituents in various steel products.
Exploring the Different Phases in the Iron-Carbon Diagram
The significance of the eutectic and eutectoid points
Identifying the phases: ferrite, austenite, and cementite
- Ferrite:
- Definition: Ferrite is a body-centered cubic (BCC) form of iron; it is magnetic, and can hold a small amount of carbon in solid solution, typically up to 0.02% at 723°C.
- Properties: Ferrite is soft and ductile with relatively low strength; it occurs in carbon steels at room temperature.
- Applications: It’s properties make ferrite good for use in magnetic materials, electrical engineering and where cold working characteristics are required to be improved.
- Austenite:
- Definition: Austenite is the face-centered cubic (FCC) form of iron. Unlike ferrite it can dissolve much more carbon i.e. up to 2.14% at 1147°C.
- Properties: Austenite is nonmagnetic with higher strength and toughness as compared to ferrite due to its ability to retain a wide range of alloying elements.
- Applications: Its stability and corrosion resistance make it involve primarily stainless steels and high-temperature alloy applications.
- Cementite:
- Definition: Cementite or iron carbide (Fe3C) represents a compound that has more carbon content than either ferrite or austenite does, in particular, 6.67 % by weight of the latter element.
- Properties: Cementite is very hard and brittle – being one of the main contributors to hardness and strength of cast irons and steels but at the same time reducing their ductility.
- Applications: It is found commonly in tool steels, white cast iron, etc., that require high strength because hardness or wear resistance must be provided for.
Understanding the transformation from austenite to pearlite
During cooling, the conversion of austenite into pearlite appears to be a crucial process in steel metallurgy. Austenite is slow cooled through the eutectoid temperature (which is about 727°C for plain carbon steels) and this transformation produces pearlite (consisting of layers made up of ferrite and cementite). The austenite ceases to be stable at temperatures below eutectoid point and this leads to the migration of carbon atoms that form lamellar arrangement of pearlite.
The resultant phase optimally combines the malleability inherent in ferrites as well as cementites hardness thereby contributing to a balanced structure that enhances the mechanical properties of steel. The characteristic features of pearlite are largely determined by the rate at which it cools; slower coolings lead to coarser bands increasing ductility but lowering hardness, while faster cooling rates result in fine overlayers which increase hardness but lower ductility.
Knowledge about how austenite turns into pearlite can help metallurgists refine their heat treatments so that they obtain specific mechanical properties needed for steel products such as those used in construction, automotive manufacturing, and tool making.
The Critical Role of Carbon Content in the Iron-Carbon Phase Diagram
How varying carbon content affects the iron-carbon alloy
The impact of carbon on steel and cast iron microstructure
Exploring low-carbon, medium-carbon, and high-carbon steels
Low-carbon steels are renowned for their high-quality ductility and toughness. These metals are normally used in making malleable products like car body panels and parts of buildings, thereby making it the best choice. They are less strong and can be easily worked on as they have lower hardness resulting to low cost.
Medium-carbon steels represent a middle ground between strength and ductility with carbon composition ranging between 0.3 to 0.6%. Such steel is commonly used in automotive applications where components need to be tough and strong at the same time such as axles or gears. Their mechanical properties can be further improved by heat treatment which makes them flexible enough to serve many purposes in different industries.
High-carbon steels containing about 0.6-1% carbon are extremely hard and wear resistant. In turn, these characteristics make high-carbon steels ideal for heavy-duty applications including cutting tools, springs, high-strength wires etc. However, brittleness due to low ductility is inevitable because of higher hardness that requires delicate handling and appropriate heat treatments.
This classification helps metallurgists choose the right type of steel depending on the project requirements so as to ensure industry-wide efficiency and longevity of application performance across various sectors.
Applying Heat Treatment Processes within the Iron-Carbon Phase Diagram
Annealing, quenching, and tempering: A metallurgist’s guide
Annealing
Annealing is the process of heating steel to a specific temperature and then cooling it slowly, usually in a furnace. This technique reduces hardness, increases malleability and relieves internal stresses. Annealing temperature depends on the type of steel but is usually within 700°C to 900°C range. It takes place at low cooling rates that allow for transformation of its microstructure into more stable one which makes it easier to work with.
Quenching
Quenching entails raising the steel’s temperature to its austenitizing point before rapidly cooling it through water, oil or other quenching media. Thus, this method elevates hardness and strength by converting austenite into martensite. However, in many cases quenching encourages brittleness and results in inner strain so that further treatment such as tempering may be necessary for the desired properties.
Tempering
Tempering follows quenching and serves to decrease brittleness while boosting toughness. In this procedure, annealed steels are reheated close enough to their critical points but below them – usually between 150°C and 650°C – and subsequently cooled gradually. Such re-heating helps in relieving stress internally by reducing its microstructure’s rigidity so as create a balance between malleability of metal and its resistance on one hand against tearing off by making stronger bond with others during this phase; therefore hardness becomes significantly reduced. Actual tempering temperatures as well as duration will depend on what particular requirement needs should be fulfilled concerning different circumstances under which steel can perform.
The effect of heat treatment on phase transformations
Optimizing mechanical properties through heat treatment
The following are the crucial steps:
- Narrowing down the temperature: The temperature of heating must be narrowly fixed to encourage required phase transformations. The austenite can change to martensite if heated marginally above eutectoid temperature then cooled in ice water.
- Cooling Rates: Cooling rate is a key determinant of ultimate microstructural details. Quenching in oil or water leads to an accelerated cooling effect and formation of martensite while air-cooling and furnace cooling give bainite or pearlite.
- Tempering: At elevated temperatures, will reduce brittleness and increase toughness. In this process, steel is reheated below its critical point so that carbon atoms diffuse in it and internal stresses become relieved.
- Material Composition: Heat treating response depends on alloying elements like chromium, nickel and molybdenum found in steel. Enhancing specific mechanical properties involves modifying alloy composition.
Decoding the Equilibrium Diagram for Metallurgists and Engineers
The phase diagram is another name for the equilibrium diagram and is an invaluable aid to metallurgists and engineers. It provides a pictorial representation of the stable phases of a material at various temperatures and compositions. Here’s how to understand it and use it:
- Understanding the Axes: Composition (usually expressed as percentages of an alloying element in the base metal) is represented on the horizontal axis, while temperature is on the vertical axis.
- Identifying Phases: The diagram has distinct areas representing separate phases or mixtures of phases such as austenite, ferrite, and cementite in steel alloys.
- Critical Points: Eutectic, eutectoid, peritectic points represent important temperatures which forecast these melting reactions during temperature changes.
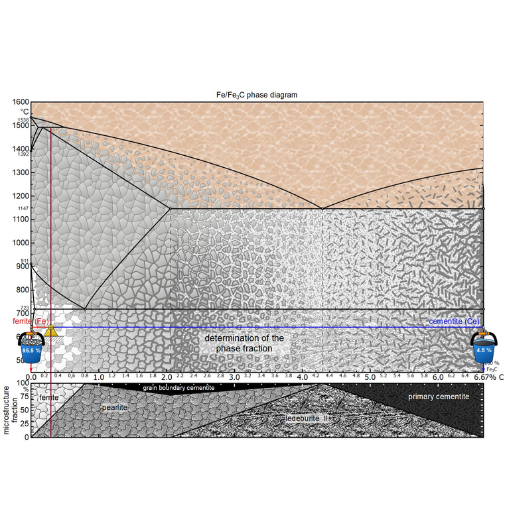
- Lever Rule: It helps one to find out proportions of phases present in a two-phase region by drawing a horizontal tie line at any given temperature and measuring lengths of segments to give fractional amounts.
- Phase Boundaries: Differentiating lines or curves on graph between different phases are referred to as phase boundaries. Whenever heating or cooling crosses them shows that there’s a change in phase.
Understanding the Fe-C equilibrium diagram for industrial applications
The diagram of Fe-C (iron-carbon) equilibrium is an important tool for the study of metallurgical properties and behavior in steel and cast iron. This diagram informs the metallurgists and engineers about phase changes at different composition levels hence has a significant impact on mechanical support as well as manufacturing processes.
- Iron-Carbon Phases: Primary phases include ferrite (α), austenite (γ), cementite (Fe3C), and pearlite. Ferrite is a soft, ductile phase while cementite is hard and brittle. Austenite is stable at higher temperatures.
- Critical Points: The major critical points on the Fe- C diagram are eutectoid point where austenite transforms to pearlite, this is found in steels; eutectic point that is important for cast irons, etc. A good example of such a stage occurs at with 0.76% carbon at 727°C producing pearlite.
- Industrial Relevance: In industrial applications like annealing, quenching, tempering heat treatments are designed using Fe-C diagram. For instance, the diagram helps in understanding how to control cooling rates to obtain desired microstructures such as martensitic for increased hardness or tempered martensitic for having hardness plus toughness ratio balance.
Reference sources
-
Fractory – Iron-Carbon Phase Diagram Explained [with Graphs]
- Fractory offers an in-depth exploration of the iron-carbon phase diagram, including comprehensive explanations and visual aids. This resource covers different states of matter, phase transformations, and critical points within the diagram.
- Source: Fractory
-
Xometry – Iron Carbon Phase Diagram: Definition and How It Works
- Xometry provides a detailed explanation of the iron-carbon phase diagram, describing its significance and how it represents various phase states of iron and its alloys under different temperature treatments. This article is valuable for understanding the practical applications of the phase diagram.
- Source: Xometry
-
BorTec – Iron-Carbon-Phase-Diagram Explained
- BorTec delivers a thorough analysis of the iron-carbon phase diagram, focusing on its role in understanding the behavior of cast iron and steel. The article discusses key phases and their implications for material properties and processing.
- Source: BorTec
Frequently Asked Questions (FAQs)
Q: What is the Iron-Carbon Phase Diagram?
A: The iron-carbon phase diagram is a graphical representation used to understand the effects of carbon phase on the properties of iron under different temperature and carbon content conditions. This diagram is essential for predicting how iron will behave in various environments, particularly in the field of metallurgy and materials science.
Q: Why is the Iron-Carbon Phase Diagram important?
A: This diagram is crucial because it helps in determining the precise chemical composition and heat treatment procedures needed to engineer steel and iron for specific applications. It is used to predict the phase transformations that occur in iron-carbon alloys, which are fundamental for designing materials with desired mechanical properties.
Q: What are the main phases identified in the Iron-Carbon Phase Diagram?
A: The main phases include: α-ferrite, a solid solution of carbon in body-centered cubic (BCC) iron; γ-austenite, a solid solution of carbon in face-centered cubic (FCC) iron; cementite or iron carbide (Fe3C), a metastable phase; ledeburite, a eutectic mixture of γ-austenite and cementite; and pearlite, a eutectoid mixture of α-ferrite and cementite. These phases provide insights into how steel’s mechanical properties can be modified.
Q: How does carbon content affect the Iron-Carbon Phase Diagram?
A: Carbon content has a significant impact on the iron-carbon phase diagram. The percentage of carbon determines the phases and microstructures that form, which in turn affect the material’s properties. For example, low carbon content typically results in a ductile material, while high carbon content can make the material hard but brittle.
Q: What is the significance of the Eutectoid Reaction in the Iron-Carbon Phase Diagram?
A: The eutectoid reaction is a crucial transformation in the iron-carbon phase diagram occurring at approximately 0.76 percent of carbon and 727°C. This reaction transforms austenite into a mixture of ferrite and cementite known as pearlite. The eutectoid reaction is pivotal for the development of steel’s mechanical properties, especially its strength and hardness.
Q: Can the Iron-Carbon Phase Diagram be used for predicting the behavior of alloys during CNC machining?
A: Yes, the iron-carbon phase diagram can be used to predict the phase transformations that may occur during the CNC machining of steel and iron alloys. By understanding the phases present at different temperatures and carbon contents, one can predict the material’s behavior under the heat and stress induced by machining, allowing for adjustments in processing to achieve desired outcomes.
Q: How are temperatures and carbon content represented in the Iron-Carbon Phase Diagram?
A: In the iron-carbon phase diagram, temperature is plotted on the y-axis and the carbon content is plotted on the x-axis. This arrangement allows for a clearer understanding of how varying temperatures and carbon levels affect the phase transitions and stability of iron-carbon alloys.
Q: What role does the α-ferrite phase play in the Iron-Carbon Phase Diagram?
A: The α-ferrite phase, being a solid solution of carbon in BCC iron, plays a crucial role in the iron-carbon phase diagram. It signifies the presence of a soft, ductile phase that can exist at room temperature and up to 912°C for pure iron. Its existence is crucial for understanding the magnetic properties of iron-carbon alloys and for developing steel with desired mechanical behaviors.
Q: How is the Iron-Carbon Phase Diagram used in the development of new steel grades?
A: The iron-carbon phase diagram is utilized in the development of new steel grades by providing crucial information on the relationship between carbon content, temperature, and phase formation. By understanding how to manipulate these variables, material scientists and engineers can design alloys with specific properties, such as increased strength, improved ductility, or enhanced wear resistance, suitable for various industrial applications.